How I made ad-hoc analytics with Reveal
On one hand, I always wanted to know if people are interested in my blog posts; on the other hand, I always disliked analytics services because of how creepy they are with their tracking.
Recently, I decided to make my own analytics service that collects only the minimum amount of data that I need. I built a simple web service that can only receive JSON objects and save them into a SQLite database, along with a timestamp. Then I vibe-coded a simple JS script that sends the current page URL with a referrer when it loads. In this post, I’ll share how I analyzed this data using Reveal.
As a bonus, in the end I’ll share a snippet that, in just 10 lines of code, allows you to view the dependency graph of any tools.deps-based project along with sizes of the dependencies — something every Clojure developer can find useful regardless of the type of project they are working on!
But let’s start with Graphviz.
Building a site map with Graphviz
Graphviz is a data visualization software that uses a simple text language, e.g., digraph { a -> b }. It’s a good fit if you want to view… well… graphs.
I used it when I wanted to see where people come from to my site, and how they move around it. This had to be shown as graph, since just running a query and viewing results is not enough to see the patterns. But I had to start with a query. Fun fact: SQLite supports JSON as a native data type, so I can look up fields inside free-form JSON values in a query. Slightly simplified, it looks like this:
SELECT
  json_extract(event, '$.referrer'),
  json_extract(event, '$.url'),
  COUNT(*)
FROM
  stats
WHERE
  json_valid(event) -- because bots just like to submit garbage...
  AND json_extract(event, '$.referrer') != ''
GROUP BY
  json_extract(event, '$.referrer'),
  json_extract(event, '$.url')
Then, once I got referrer + url + count tuples, I massaged them into a Graphviz description:
(str "digraph { rankdir=LR; node[shape=record];"
     (->> (db/execute! db referrer-map-query)
          (map (fn [[from to count]]
                 (str (pr-str from) "->" (pr-str to) " [label=\"" count "\"]")))
          (str/join "\n"))
     "}")
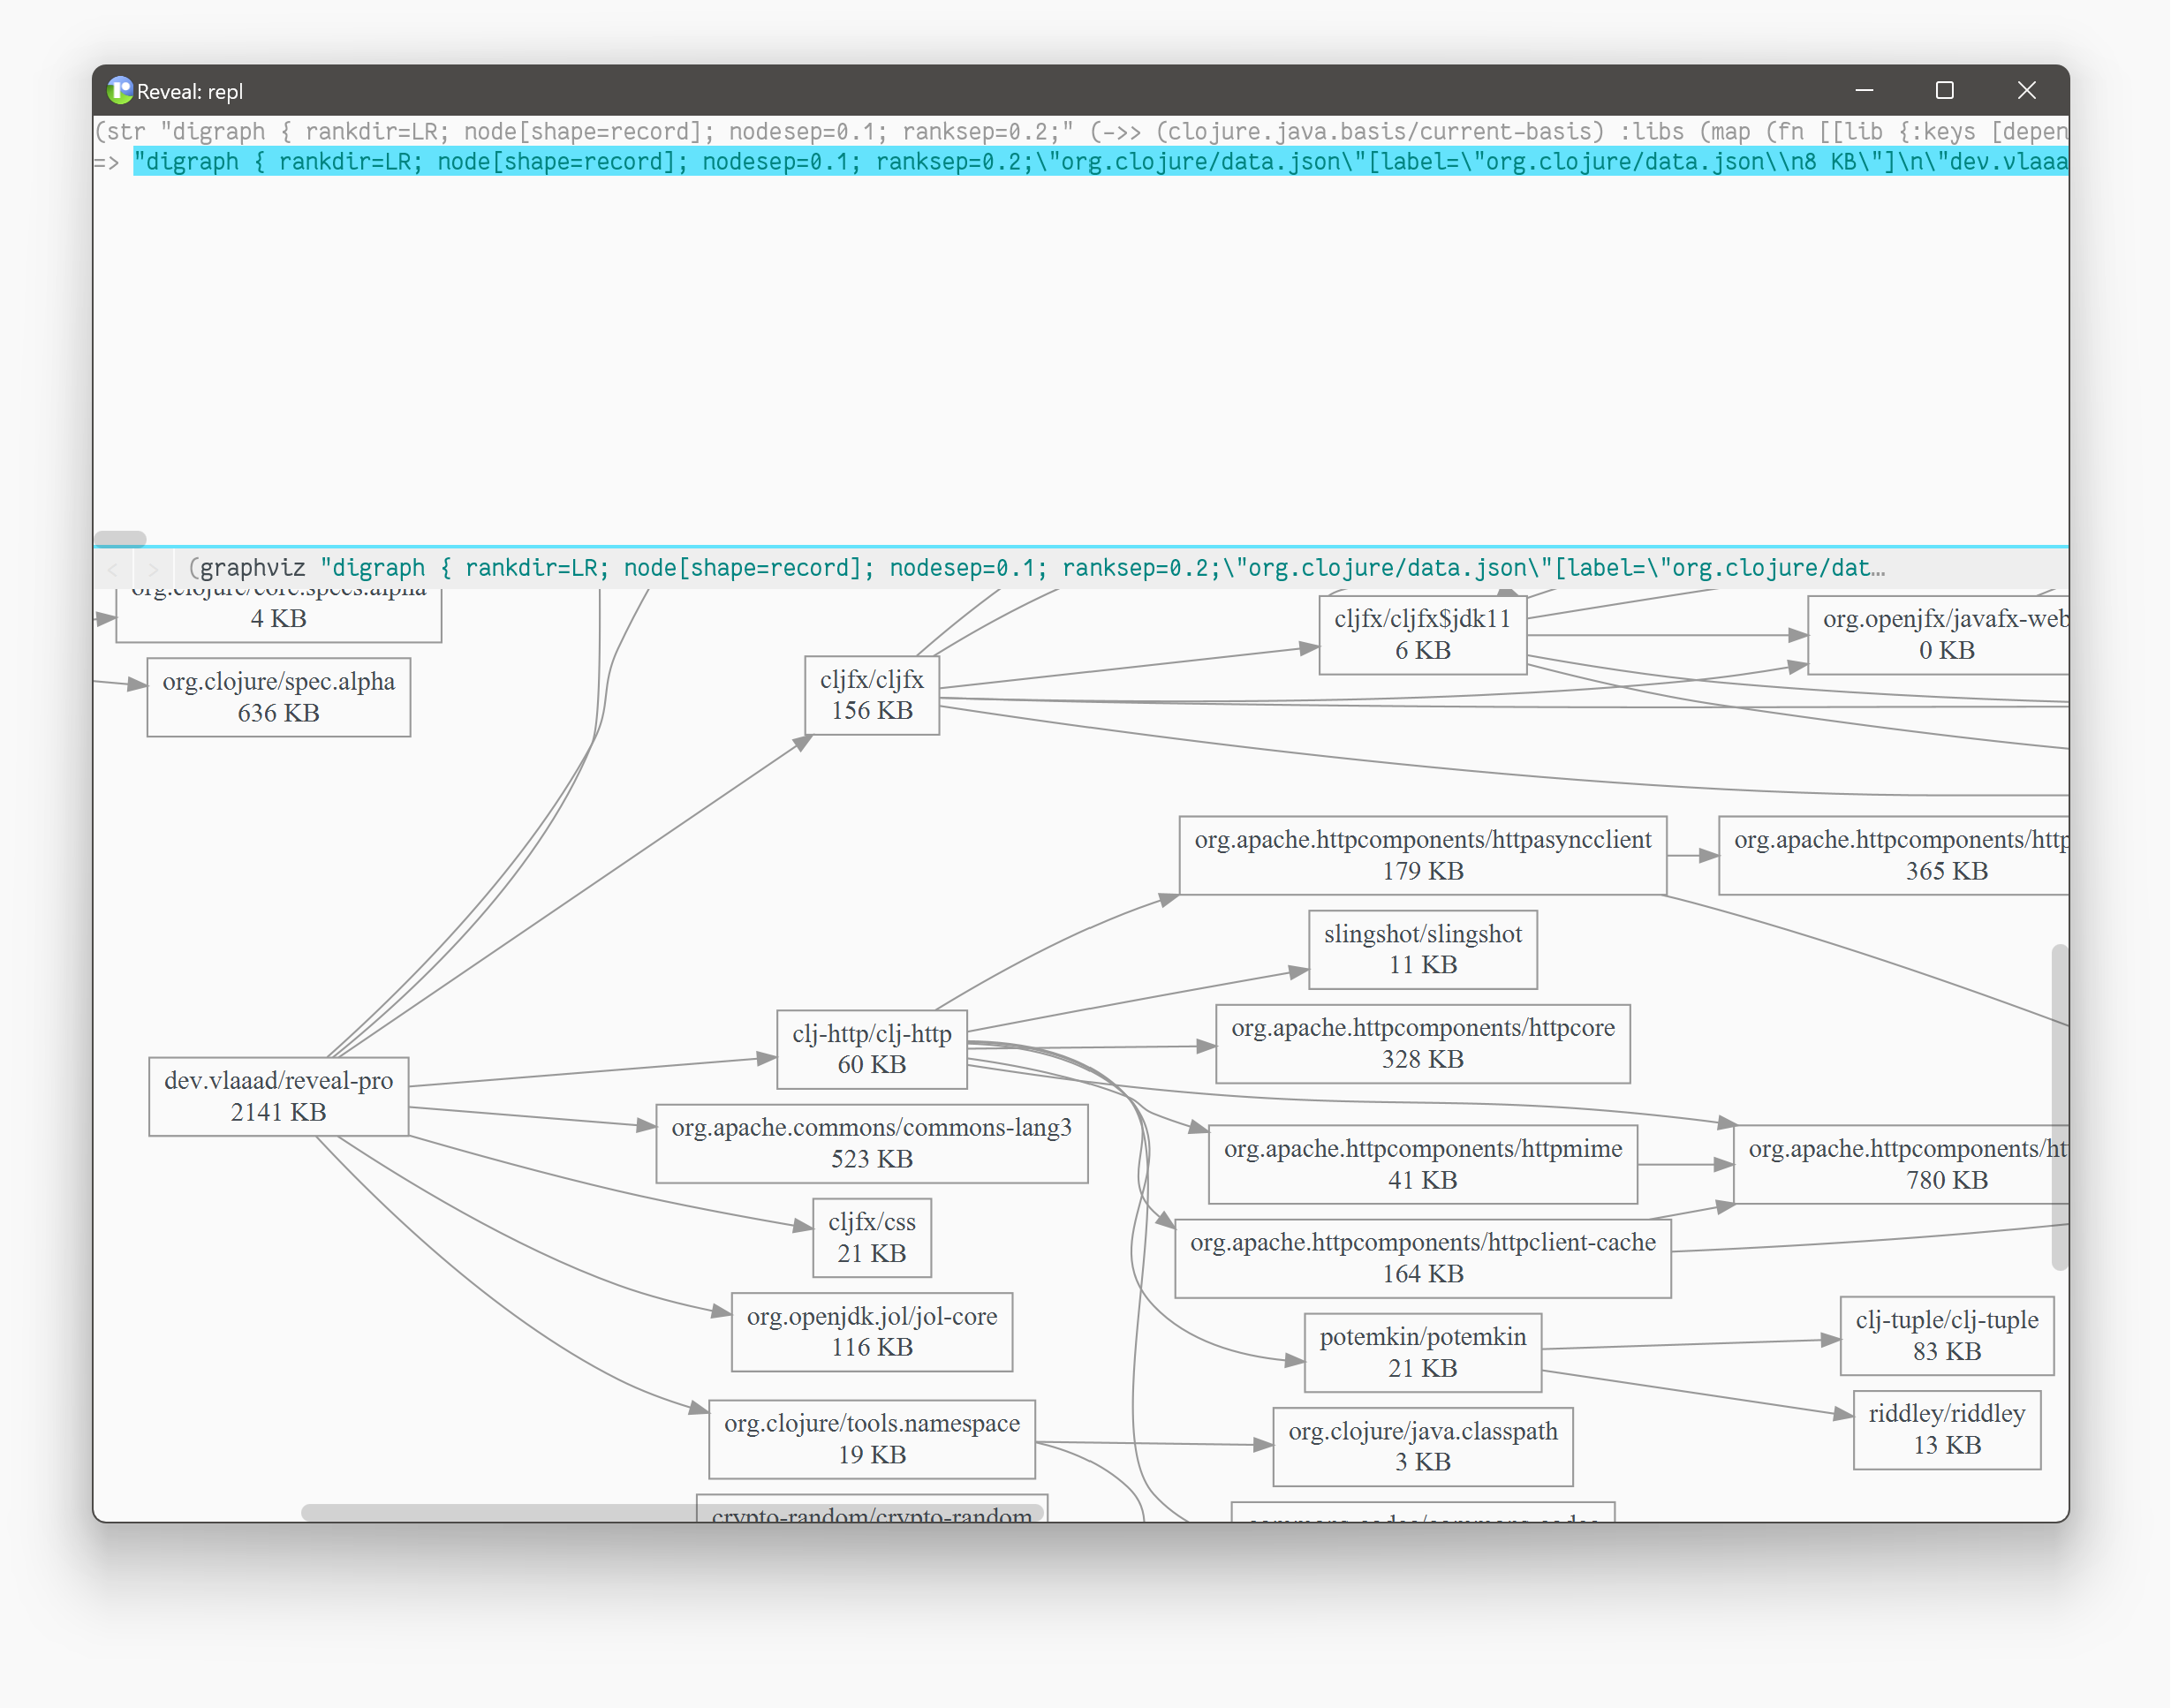
Since I don’t have a need to build web pages with dashboards, it was enough to use Reveal’s Graphviz viewer. I only needed to create a graphviz description string, select the graphviz action in Reveal, and voila:
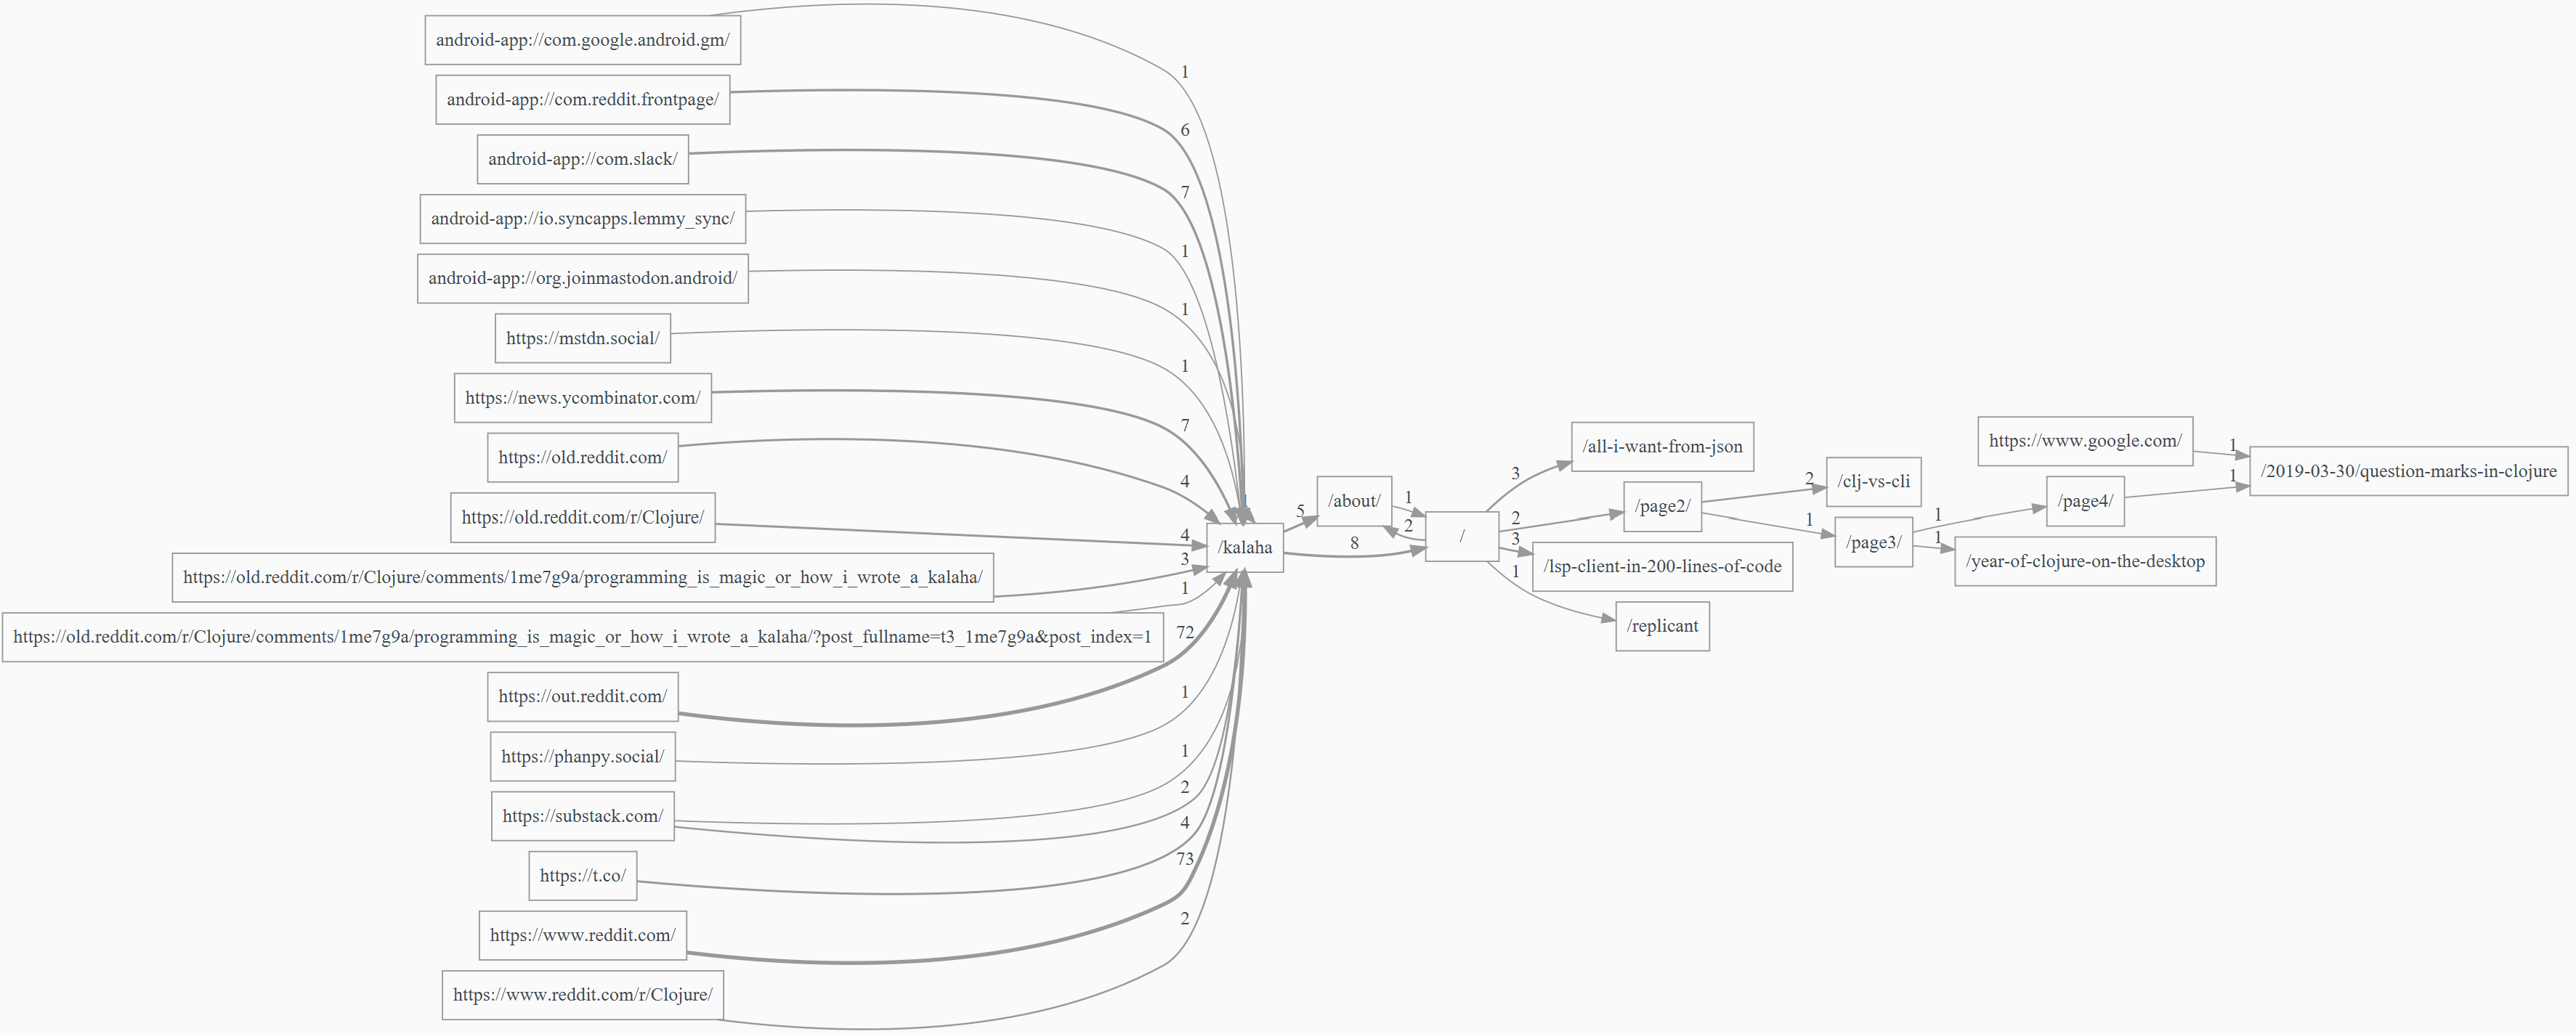
Turns out, not only do people actually visit the blog post I shared on Reddit, but some people are actually interested in seeing more and open other pages! This motivated me to update the about page, which previously only had a single sentence with my name — turns out it was actually visited 😬
Another fun fact I discovered after running analytics for a while — ChatGPT sometimes refers users to non-existing pages on my site: 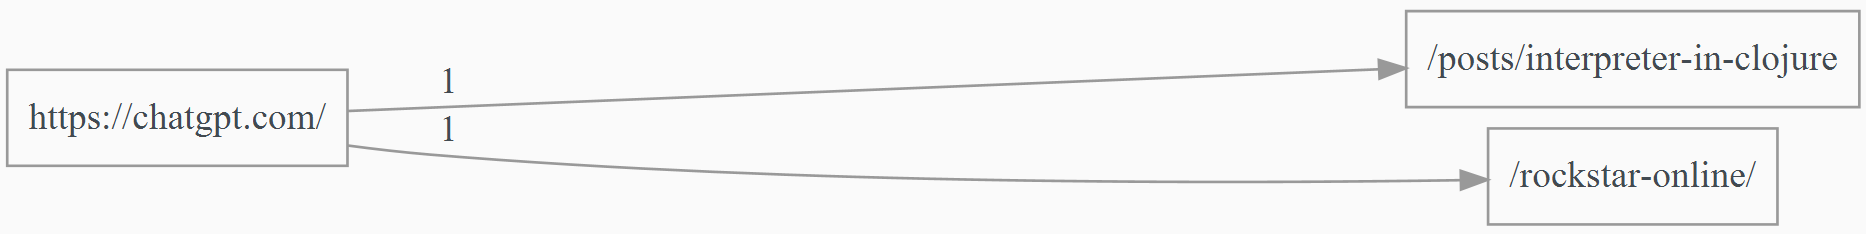
Page visits over time with Vega
While Graphviz is an essential tool for showing graphs, there is another widely used data visualizer: Vega. Vega can do data grouping by itself, so the SQL query is even simpler:
SELECT
  json_extract(event, '$.url') as url, created_at
FROM
  stats
WHERE
  json_valid(event)
Then came the time to view the results using Reveal’s Vega viewer:
{:fx/type vlaaad.reveal/vega
 :spec {:mark {:type "bar" :tooltip true}
        :encoding {:x {:field "created_at" :type "temporal" :timeUnit "yearmonthdatehours"}
                   :y {:field "url" :aggregate "count"}
                   :color {:field "url" :legend {:orient "bottom" :columns 5}}}}
 :data (db/execute! db timed-url-query)}
Such a map can be viewed in Reveal using view action: 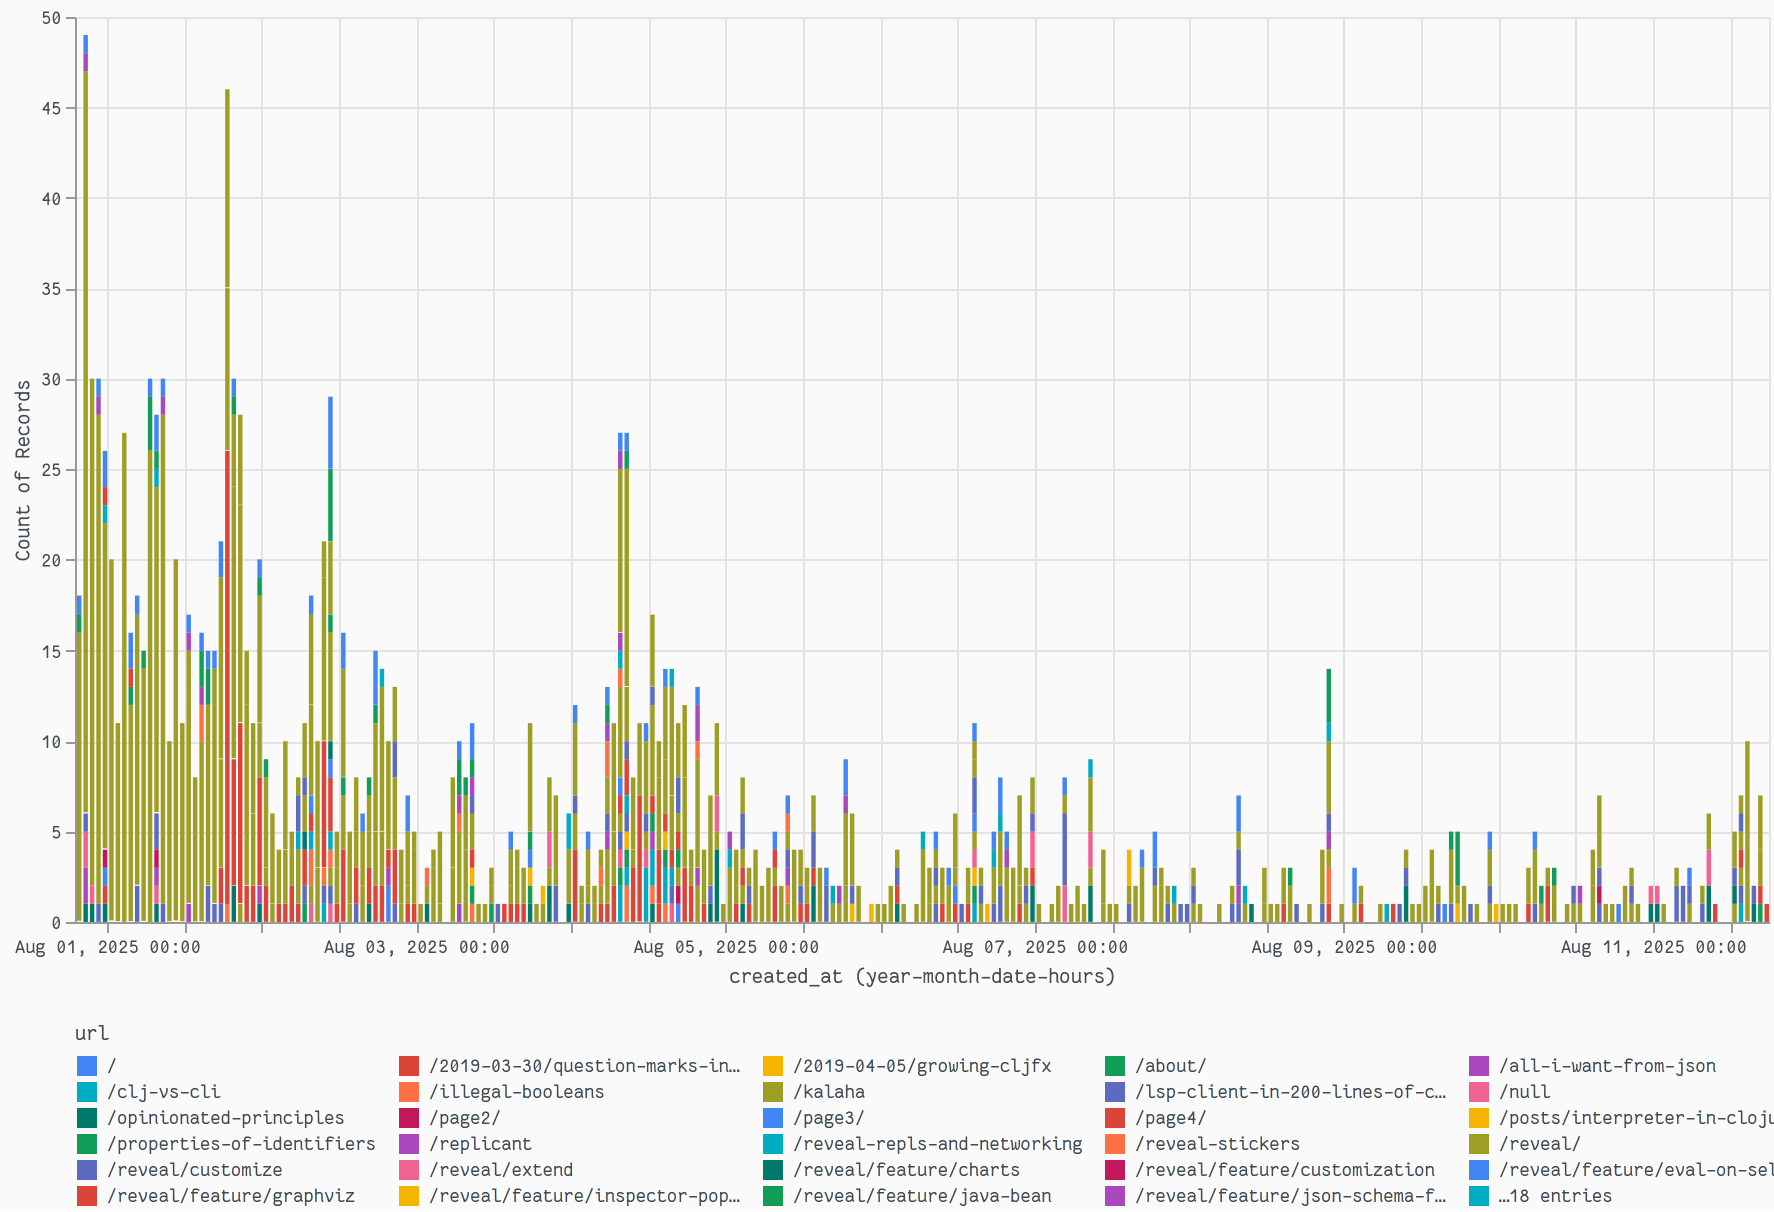
I find Vega very cool; you can do very different visualizations with very small configuration maps. The downside of Vega is a very complex grammar, which is much harder to remember than the Graphviz one, though in practice, LLMs can produce Vega descriptions if you ask them what you want.
Conclusion and a bonus
It’s very convenient when your REPL is capable of doing more than just showing text. While the examples shared above could be considered something from the realm of “data analysis” and not day-to-day programming, there is still a need sometimes to visualize data with graphs and/or charts. For example, to analyze dependencies of your project! If you use tools.deps, you can write the following code in your REPL to create a dependency graph:
(str "digraph { rankdir=LR; node[shape=record]; nodesep=0.1; ranksep=0.2;"
     (->> (clojure.java.basis/current-basis)
          :libs
          (map (fn [[lib {:keys [dependents paths]}]]
                 (let [lib-id (pr-str (str lib))
                       kbs (int (/ (reduce + 0 (map (comp java.io.File/.length java.io.File/new) paths)) 1000))]
                   (str lib-id "[label=" (pr-str (str lib "\n" kbs " KB")) "]\n"
                        (clojure.string/join "\n" (map #(str (pr-str (str %)) "->" lib-id) dependents))))))
          (clojure.string/join "\n"))
    "}")
Yep, just 10 lines to reimplement tools.deps.graph with Reveal: