View Vega charts in Reveal
Reveal charts
So I made this explorable REPL output pane called Reveal. It’s built on top of JavaFX, a UI framework for JVM that has built-in charts. Reveal provides access to those charts, where data in a shape that fits the expected chart input shape can be viewed visually. Those charts have some interesting properties, specifically that they are not leaves in terms of exploration — you can select a data point and then access the object in the VM to explore it further. Here is an example:
I think that’s pretty nice, but one downside of these JavaFX charts is that their visualization abilities are limited: axes don’t have scales other than linear, you can’t put labels on the chart, can’t mix lines with areas, etc.
Vega charts
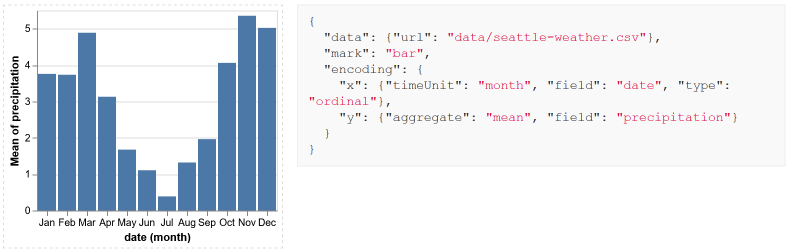
I’m no data scientist, so you might disagree with me on that, but there is a pretty good visualization library for the web called Vega. It uses declarative syntax (json) to describe charts. There is also Vega-Lite — easy API to Vega that makes describing those charts much more concise. Here is an example of such a chart along with the chart spec:
Vega in Reveal
Since JavaFX includes a browser capable of showing vega charts, and Vega can be fairly easy embedded into web pages, and it’s trivial to convert Clojure data structures to json, I created a simple view that shows Vega charts:
(require '[cljfx.ext.web-view :as fx.ext.web-view]
         '[clojure.data.json :as json]) ;; the only external dependency

(defn vega-view [{:keys [spec]}]
  {:fx/type fx.ext.web-view/with-engine-props
   :props {:content (str "
<head>
  <script src=\"https://cdn.jsdelivr.net/npm/vega@5\"></script>
  <script src=\"https://cdn.jsdelivr.net/npm/vega-lite@4\"></script>
  <script src=\"https://cdn.jsdelivr.net/npm/vega-embed@6\"></script>
</head>
<body>
  <div id=\"view\"></div>
  <script>vegaEmbed('#view', " (json/write-str spec) ");</script>
</body>")}
   :desc {:fx/type :web-view}})
Now I can create a vega view in the REPL…
{:fx/type vega-view
 :spec {:data {:url "https://vega.github.io/vega-lite/data/seattle-weather.csv"}
               :mark :bar
               :encoding {:x {:timeUnit :month
                              :field :date
                              :type :ordinal}
                          :y {:aggregate :mean
                              :field :precipitation}}}}
…and view it in Reveal:
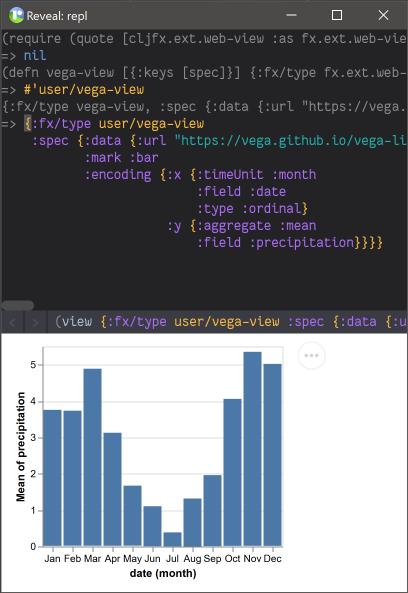
Yes, this view is a leaf, but it’s a very powerful leaf that can display a big variety of data visualizations.
Hacking at the REPL
I use this vega-view for stock market-related explorations. I combine it with Reveal commands for automatically showing views so I don’t have to leave the editor — you can find an example here. This way I can iterate on vega visualizations in the REPL one eval at a time, and see the updated chart immediately. I find this setup fantastic — Clojure REPL is a productive and fun environment, and Reveal brings a powerful visualization aspect that integrates into REPL-aided development workflow very well. Wow, that didn’t sound unbiased at all :D
Anyway, if you haven’t already, I would suggest giving Reveal a try!